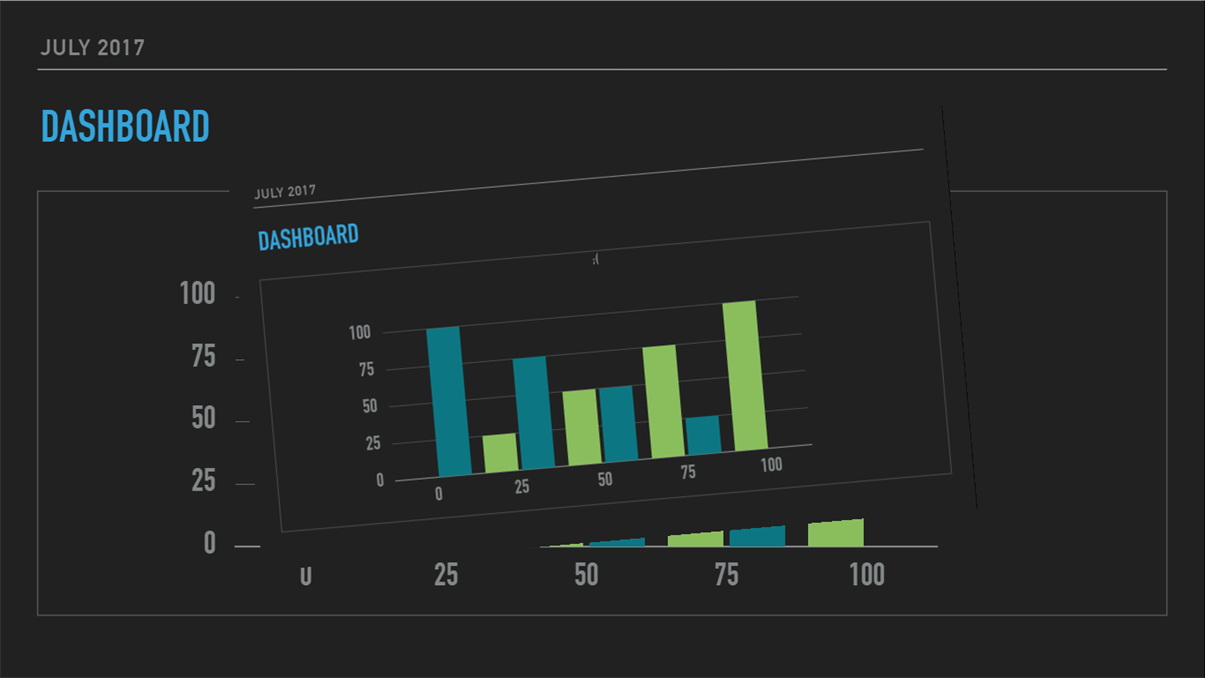
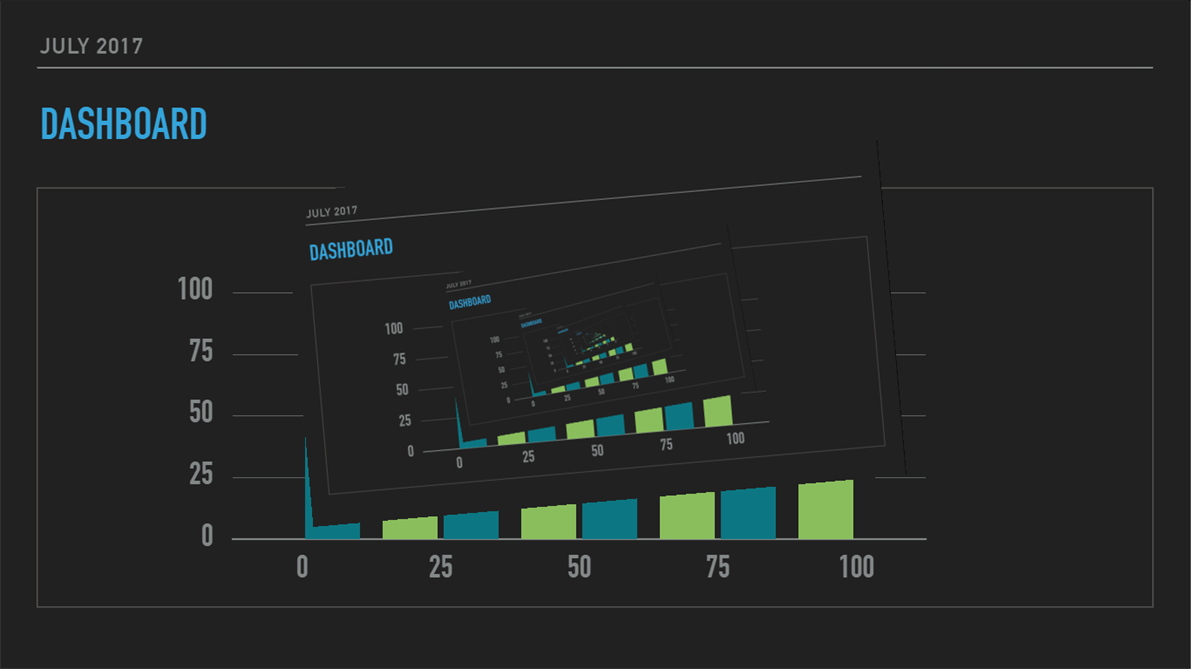
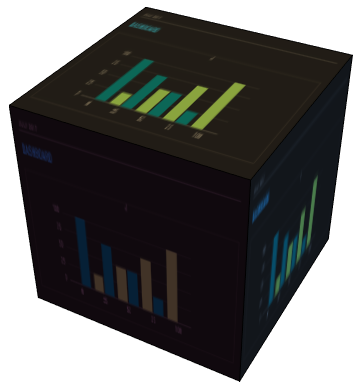
Dashbored
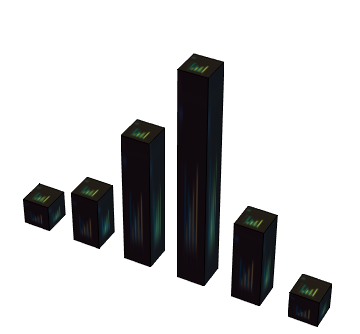
Rending
Trendering
Coalation
Pregress
Progress II
Intersaction
Review
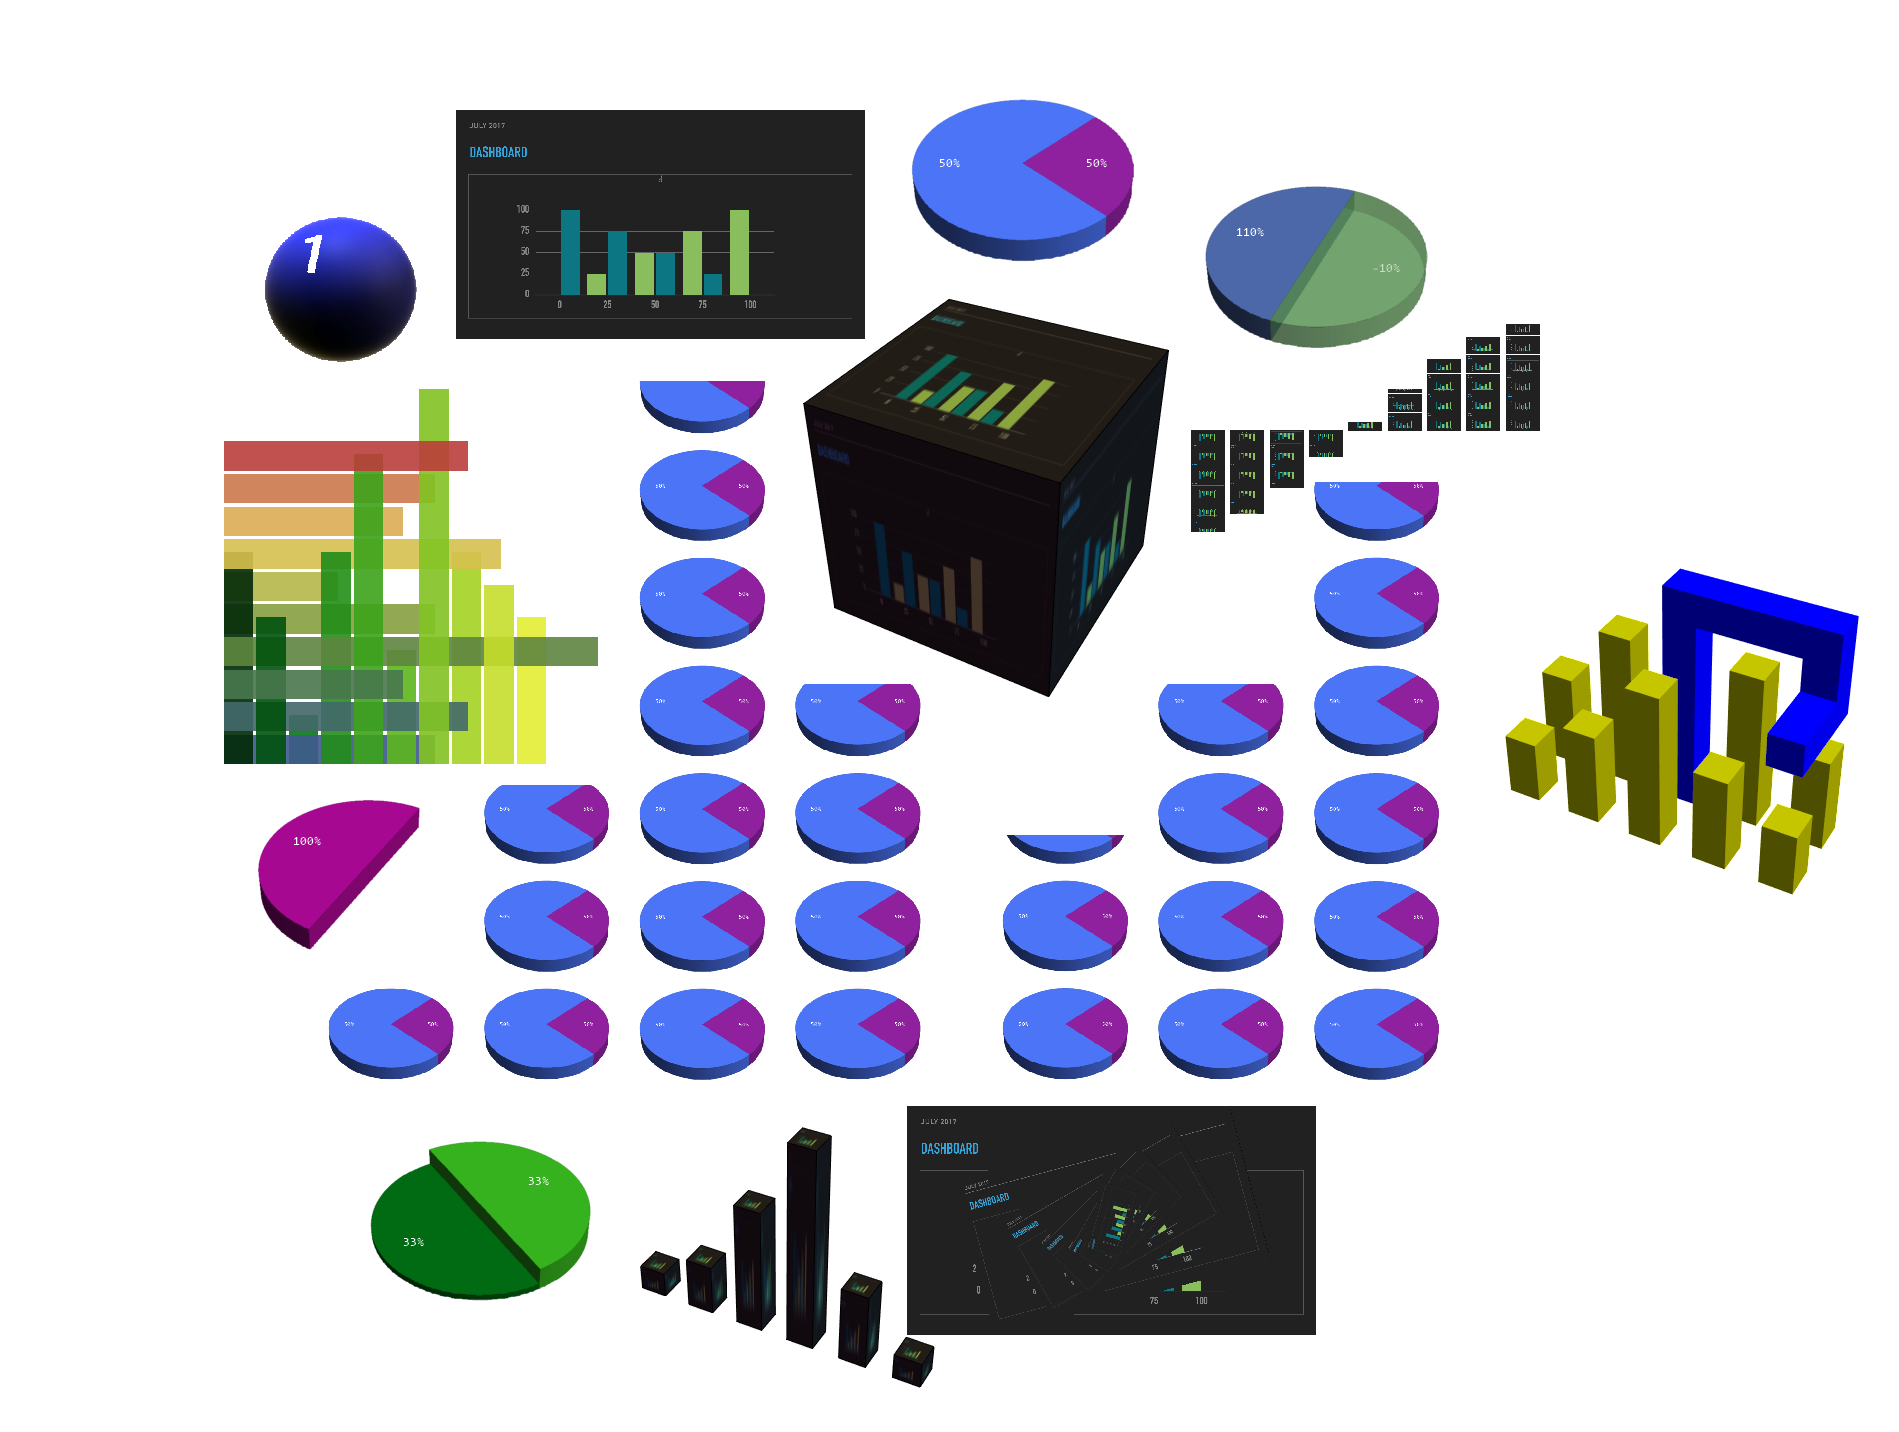
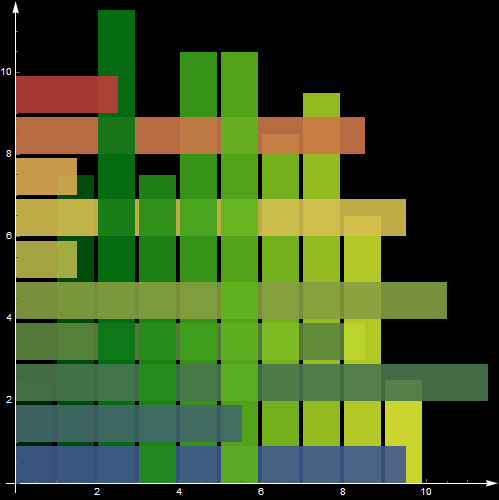
Fig. 1: “Fig. 2”
Outlier
Pie-to-Bar Ratio
Data vs. Data
“Weak...”
Analyzing the Analysis
Analyzing the Analysis of the Analysis of the Analysis
Pivot
Trend
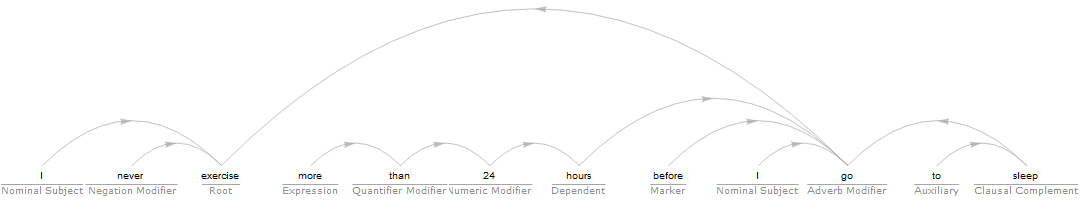
Resolving Ambiguity
Dashboards per Dashboard
Legend
Figures created with Wolfram Mathematica 11.
Robert Dickau, 2017–2026.
[ home ] || [ 2017-10-26 ]
robertdickau.com/presentation.html